The spectrum of a signal is its Fourier transform . It’s a complex-valued function of frequency that captures how the signal is distributed across frequencies.
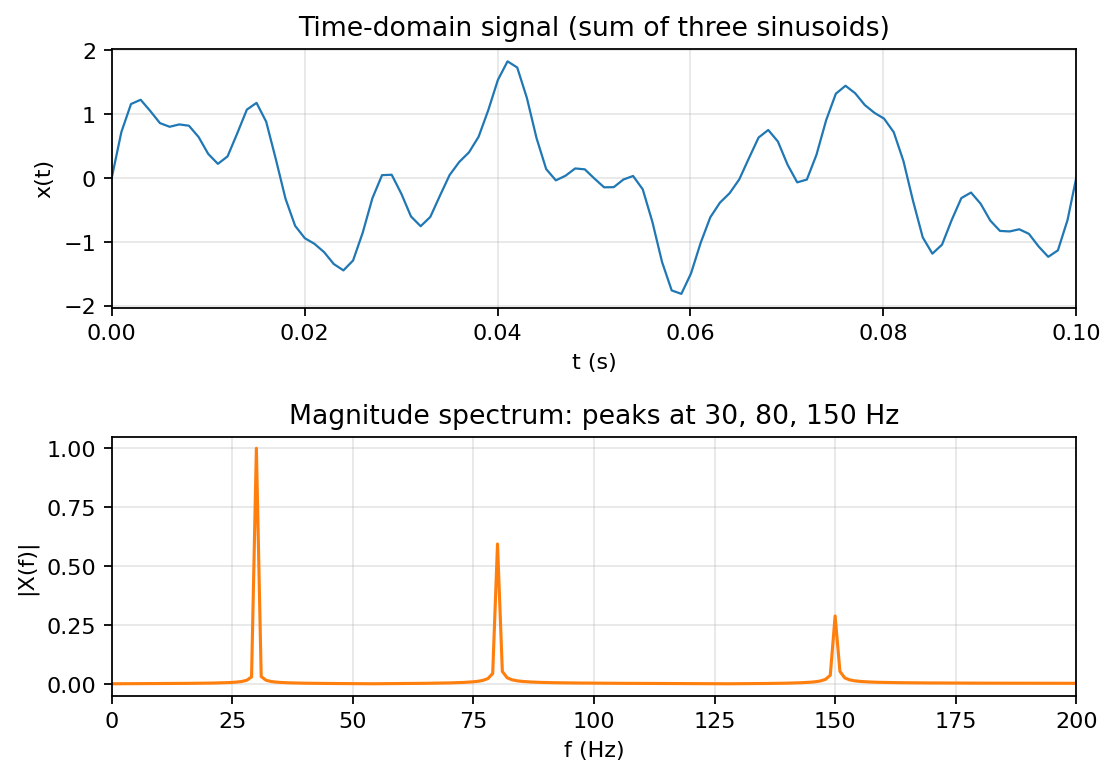 Top: a time-domain signal made of 30, 80, 150 Hz sinusoids. Bottom: its magnitude spectrum shows three peaks.
Two views of the spectrum:
- Amplitude spectrum : how much of frequency is in .
- Phase spectrum : where the cosine-sine combination sits in time at that frequency.
For real , the amplitude spectrum is even in and the phase spectrum is odd (conjugate symmetry). The spectrum is complex even when is real.
Spectral classification
By where the energy in is concentrated, signals are classified:
- Lowpass: most energy near . Smooth in time, slow oscillations.
- Highpass: most energy at high frequencies. Spikes and rapid transitions in time.
- Bandpass: energy concentrated in a narrow band around some center frequency (away from DC).
- Narrowband: small bandwidth (sharp spectrum). Long time-domain extent.
- Wideband: broad bandwidth. Short time-domain extent. See Time-bandwidth tradeoff.
This vocabulary is used constantly when designing filters in Chapter 9.
Line spectrum vs continuous spectrum
A periodic signal has a line spectrum — discrete impulses at the harmonic frequencies , with strengths equal to the Fourier series coefficients. An aperiodic signal has a continuous spectrum — a smooth function .
Both cases are unified within the CTFT framework: the transform of a periodic signal is a train of impulses at the harmonic locations, .
Units
If has units (volts, amperes, pascals…), has those units times time. For voltage in and time in seconds, has units . This is why is sometimes called a spectral density: “how much voltage per Hz of bandwidth.”
Physical meaning at a point
The value at a single frequency is the complex amplitude of the (infinitesimal) sinusoidal component at . Writing , the contribution to from a small frequency band around is (the factor of 2 comes from the conjugate-pair of contributions).
The spectrum encodes, at every frequency, both the strength of a component and its phase. The reconstruction integral
is a continuous superposition of these sinusoidal pieces, weighted by .
In LTI systems
For an LTI system, the output spectrum is the input spectrum multiplied by the frequency response:
Drawing , , and their product is the standard way to visualize what a system does to a signal. Filters with sharp passbands and stopbands shape the output spectrum cleanly; broad-tailed filters produce broader output spectra.