The frequency response of an LTI system is the Fourier transform of its impulse response :
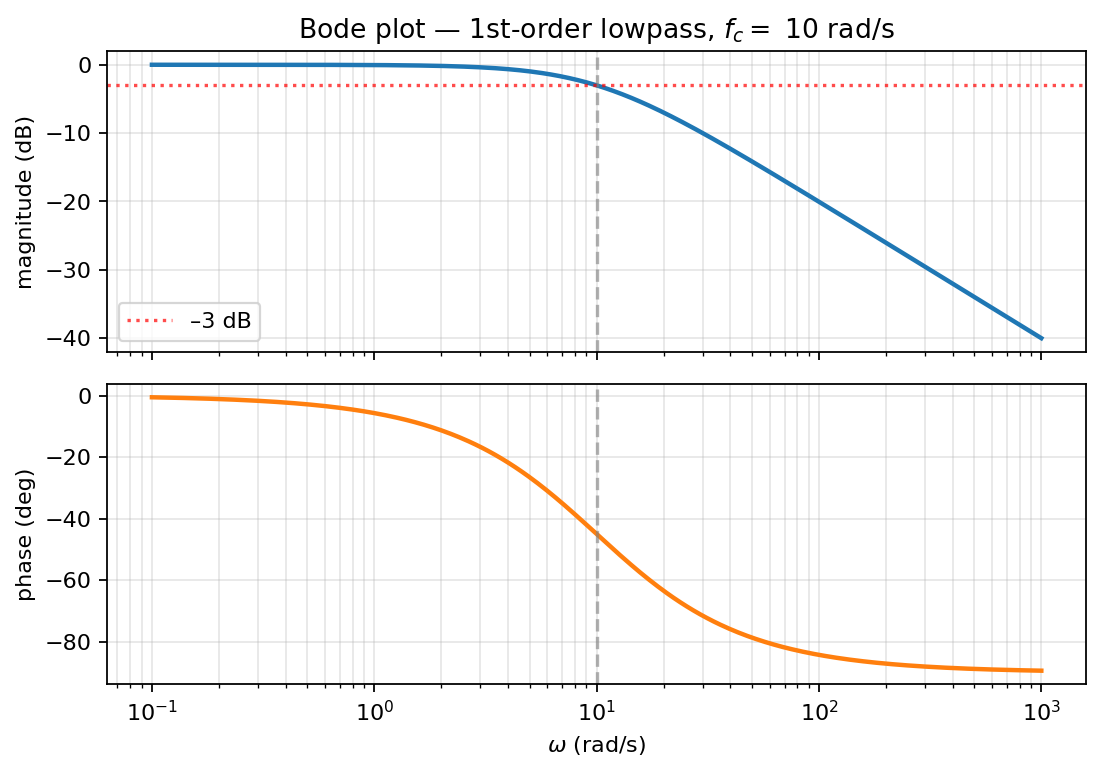 First-order lowpass Bode plot: magnitude in dB and phase in degrees vs log frequency.
It is a complex-valued function of frequency that completely characterizes the system. Two pieces:
- , the magnitude response: how much the system amplifies or attenuates the frequency component at .
- , the phase response: how much it phase-shifts that frequency.
What it does to inputs
By the convolution theorem, if input has spectrum , then output has spectrum
For each frequency , the system multiplies the input’s spectral component by the complex number . So the output spectrum is the input spectrum, shaped by the system’s frequency response.
For a real sinusoidal input , the output is
Amplitude gets scaled by , phase gets shifted by . That’s the whole of frequency-response analysis: once you know , you know what the system does to every sinusoid, and by superposition to every signal.
Three ways to compute it
For an LTI system, the frequency response has three equivalent definitions:
- From the impulse response: .
- As the eigenvalue at frequency : feed in , the output is . See Eigenfunction of LTI system.
- From the transfer function: . Substitute into the Laplace-transform transfer function. Valid when the system is stable (so the imaginary axis is in the ROC).
For a stable system, the three definitions agree. For an unstable system, the Fourier transform of may not exist, and only the s-domain description works.
ω-form
Same object, different variable: at . The ω-form is more common in filter transfer functions and the Bode plot conventions, especially in textbooks; the f-form is more common in communications and signals-processing notation.
You’ll need fluency in both. The course’s official preference is f-form, but the formula sheet and filter chapters use both.
Reading off behavior
- Region where is large: passband, frequencies that get through.
- Region where is small: stopband, frequencies that get blocked.
- Region of transition: rolloff, gradual change from pass to stop.
A lowpass filter has high near DC and low at high frequencies. A highpass has the opposite. A bandpass has a peak around some center frequency. A bandstop (notch) has a dip around some center frequency.
In the Bode plot
is usually plotted in decibels on a logarithmic frequency axis, the Bode plot. Phase goes in degrees on the same axis. This compresses a wide frequency range into a readable picture and makes pole-zero structure visible at a glance.
Amplifier frequency response
A capacitively-coupled transistor amplifier is an LTI system whose frequency response has a three-band shape: a low-frequency band where the large coupling/bypass capacitors roll the gain off, a flat midband at gain where every capacitance is negligible, and a high-frequency band where the device’s own tiny parasitic capacitances roll it off again. The bandwidth is . Full treatment in Amplifier frequency response; the gain-versus-bandwidth trade is the Gain-bandwidth product .