A firm’s total cost at a given output level is the sum of fixed costs (independent of output) and variable costs (scaling with output):
 Total cost = fixed + variable; the slope is the marginal cost.
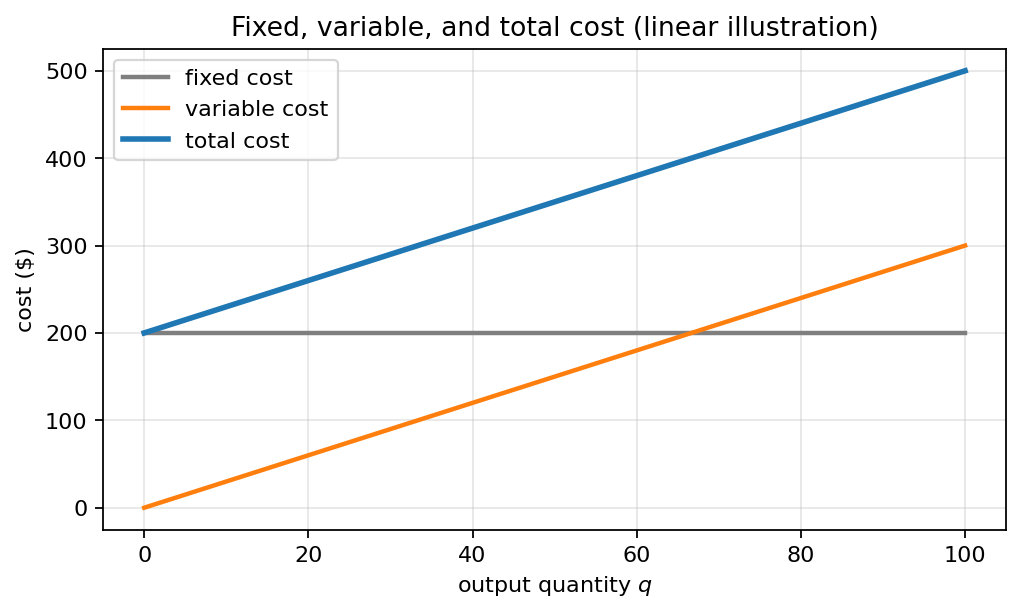
For most engineering modelling, is approximated as linear in : , where is the per-unit variable cost. So total cost is
This is the equation of a straight line on a (quantity, cost) plot, with -intercept (the fixed cost paid even at zero output) and slope (the cost per additional unit).
Pair this with the total-revenue line for selling price , and you can solve for the break-even quantity at which :
The denominator is the contribution margin per unit: how much each unit contributes toward covering fixed cost once variable cost is paid. The break-even quantity is fixed cost divided by contribution margin per unit.
The linear approximation breaks at the extremes. Bulk-purchase discounts make the variable-cost curve concave at moderate . Past capacity, overtime and rushed shipping bend it back up (convex). For most decisions the linear form is accurate enough; for capacity planning, the non-linear regime matters.
See Break-even analysis.